Bite Me: The Right Social Metrics for Zombies and Vampires on TV
Forbes recently published a list of “3 metrics that really matter [to a] startup.” Topping that list at number one is measuring how engaged users are, since users who sign up for a service but rarely use it have little value and users who constantly use the service are of great value. Similarly, Argus recently concluded that GetGlue, the social networking site for television viewers, is a better metric for measuring the relationship between social media buzz and viewership than was overall buzz data about TV shows. Argus Insights has concluded that there is a relationship between buzz on Twitter and weekly television viewership.
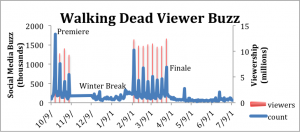
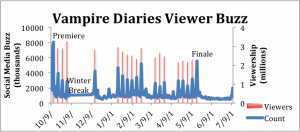
Two of the most popular shows on television are The Walking Dead and The Vampire Diaries. The Walking Dead is based on a comic book series and is a horror, post-apocalyptic drama and The Vampire Diaries is based on a book series and is a supernatural drama. Given each show’s fan base, Argus set out to investigate if there was a correlation between social media buzz on Twitter and viewership throughout the shows’ seasons. Although there are very few studies—including Nielsen Holding’s most recent study that relates buzz to TV ratings—about the influence of social media on television, Argus began researching viewership per episode and the buzz per day for the duration of the two television seasons. Each television series had two sets of data: viewership in millions and Twitter social media buzz in thousands. Figure 1 and Figure 2 are graphical representations of these relationships.

- Figure 1. The R2 is .026, meaning there was very little correlation between viewership and social media buzz on Twitter.

- Figure 2. The R2 is .2067, meaning there is a correlation between Vampire Diaries viewership and social media buzz on Twitter.
The shows experienced rises and falls of social media buzz and viewership that corresponded to weekly airings. Season premieres and finales attracted more buzz than the regular season, though the buzz generated by the finale of The Vampire Diaries paled in comparison to The Walking Dead finale. The noticeable higher levels of buzz at the beginning and ending of the season drove the creation of additional test cases as we set up the hypothesis for analysis. Argus evaluated two specific cases:
3 Day Buzz: By focusing on buzz from three specific days (the day before, the day of, and the day after an airing), Argus had the opportunity to concentrate on buzz most likely associated with the actual broadcast of the episode. Buzz for those three days was totaled for a “3 Day Buzz” value (See Table 1).
4 Day Buzz: Argus shifted focus to buzz from the week prior to an airing in order to assess if buzz four days before a broadcast impacted whether more people watched the next broadcast. Buzz from an actual broadcast and four days prior to the airing were totaled to attain a value for “4 Day Buzz” (See Table 2).
Table 1. Mentions of Walking Dead taken from zombie stream limited to unique users
Case | R2 w/ premiere-finale | R2 w/o premiere-finale |
General | .026 | N/A |
3Day Buzz | .0624 | .0748 |
4 Day Buzz | .106 | .113 |
Table 2. Mentions of Vampire Diaries taken from vampire stream limited to unique users
Case | R2 w/ premiere-finale | R2 w/o premiere-finale |
General | .2067 | N/A |
3 Day Buzz | .222 | .334 |
4 Day Buzz | .247 | .276 |
Season premieres and finales are unique cases because they demonstrate predictably high levels of viewership and buzz. Therefore, it is important to analyze data with and without the premieres and finales. Interestingly, R2 increased after premiere and finale were removed from the data being observed. This increase is significant because it implies that the data without premiere and finale is more accurate of the fluctuations in viewers. Loyal fans are more likely to watch a series on a weekly basis than fans that are only likely to watch premieres or finales because of hype. Information about The Walking Dead indicates that while there are millions of viewers, only a fraction of those viewers use Twitter as a way to engage with the show and other fans. On the contrary, Vampire Diaries fans are more likely to use Twitter to engage with the show and other fans (see Table 2).
GetGlue is a social networking site for television fans. The application allows viewers to “check-in” while they watch live television in exchange for gaining access to exclusive stickers of that particular show. Argus obtained data about buzz that GetGlue was generating with regards to The Walking Dead and The Vampire Diaries and applied the “3 Day Buzz” and “4 Day Buzz” cases to the data with the purpose of further exploring the explanatory relationship between buzz and viewership (see Table 3 and Table 4).
Table 3. Mentions of GetGlue and Walking Dead limited to unique users
Case | R2 w/ premiere-finale | R2 w/o premiere-finale |
3 Day Buzz | .189 | .493 |
4 Day Buzz | .102 | .400 |
Table 4. Mentions of GetGlue and Vampire Diaries limited to unique users
Case | R2 w/ premiere-finale | R2 w/o premiere-finale |
3 Day Buzz | .430 | .358 |
4 Day Buzz | .361 | .277 |
While evaluating a show without a premiere and finale was necessary to attain an accurate portrayal of viewers, GetGlue R2 results present a different conclusion. While the R2 values for The Walking Dead follow previous trends, The Vampire Diaries R2 decrease. This outcome could be attributed to viewership demographics. Vampire Diaries viewers consist of more women who are into social viewing—which includes dual-screen viewing and using Twitter to engage with the series—that are more likely to use Getglue. Walking Dead viewers, on the other hand, consist of fewer women, are not into social viewing, and are therefore less likely to engage with GetGlue.
In conclusion, Argus found that there is a relationship between social media buzz and viewership, although it is not very robust. The lack of strong correlation can be attributed to several different factors, including demographics. Given the different themes and nature of the shows, more men watch The Walking Dead, while more women watch The Vampire Diaries (see Figure 3).


