Smart Home Service Providers Slide After Tremendous Holiday Season: Q1 2017 Results
While much of the Smart Home market is focused on Do It Yourself, there has also been robust demand within the Do It For Me part of the market supported by Smart Home Service providers like Vivint or Comcast Xfinity Home. While overall consumer interest declined in Q1 2017 over Q4 2016, March 2017 saw a significant increase over February 2017, indicating that a combination of spring promotions and increased interest in Do It For Me based on holiday DIY experiments.
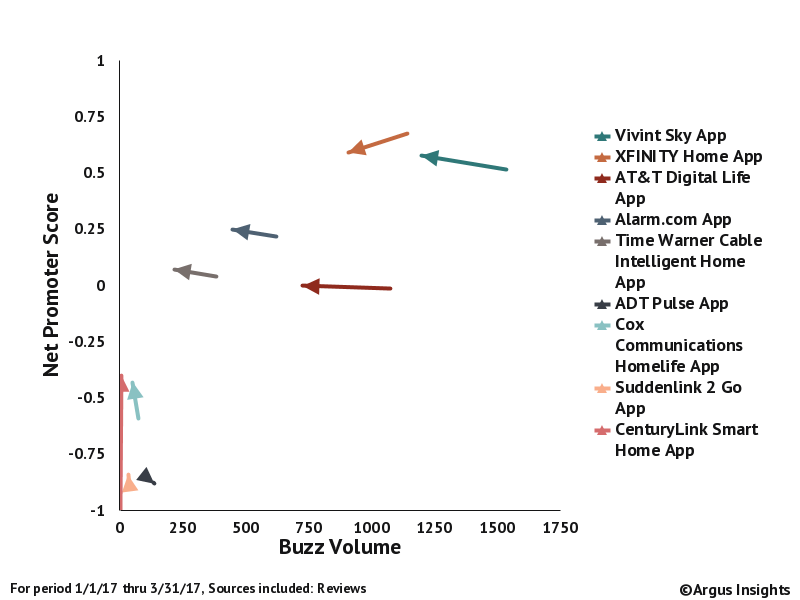
Vivint clearly wins out for the overall consumer demand during Q1. Most service provider customers write reviews soon after they sign up or after a new version of the App has been released. We can see from the graph above that Vivint leads the overall tally of quarterly mindshare but lags a bit behind Comcast with respect to Net Promoter Score. AT&T is still in the mix but has more frustrated consumers than Comcast or Vivint. In March, Vivint saw improvements in their UX while Comcast dropped over the quarter so they they are within 1% of NPS from each other.
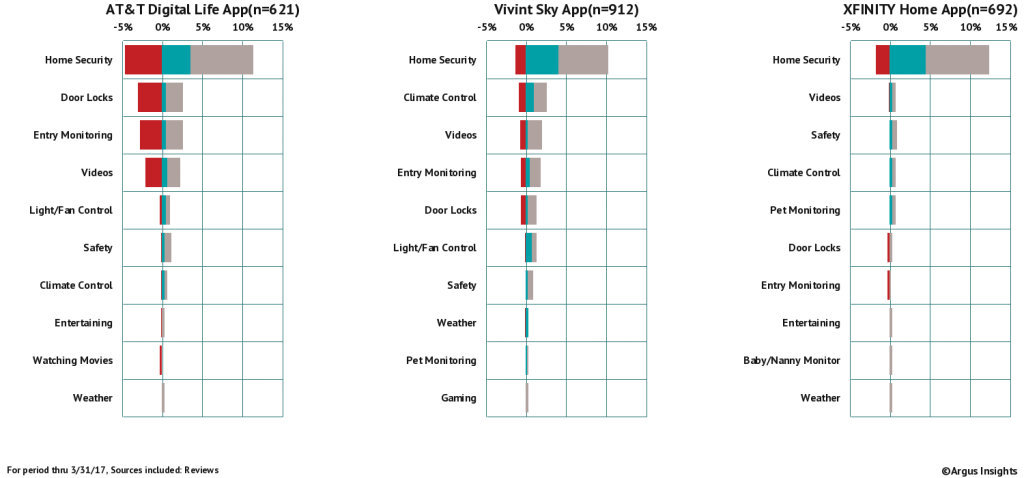
When we dig deeper into how consumers report using their Smart Home with their lives, it should come as no surprise that Home Security is the most discussed usage scenario. Securing your home is still the main reason consumers sign up for Do It For Me services though you can see this shifting for Vivint as they list Climate Control more than any other service provider. AT&T customers are clearly grump about their security and entry control experience with Digital Life. Comcast customers are focused on Security almost to the exclusion of other scenarios though Xfinity customers mention monitoring their pets more than AT&T or Vivint customers.
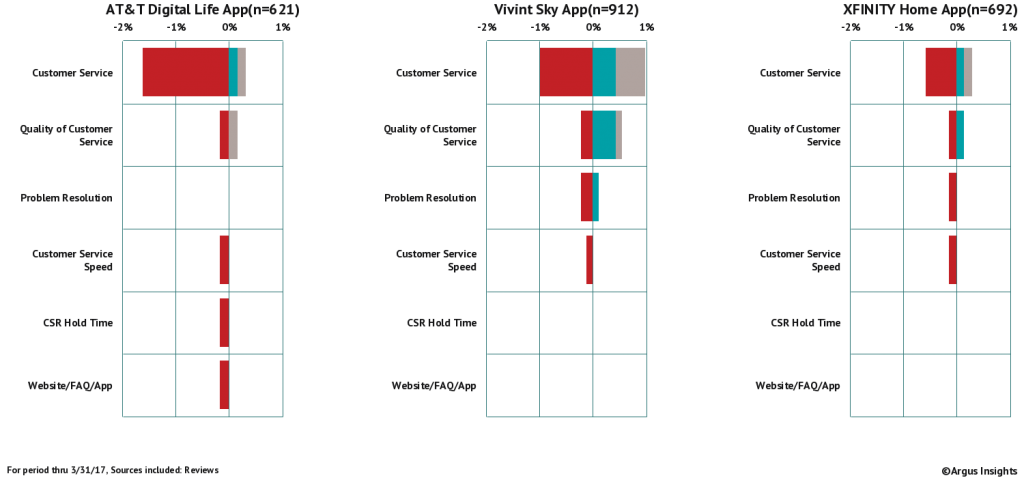
Customers of Do It For Me tend to value Customer Service in their selection of service providers. While consumers do not mention their experience with Customer Service as much as other topics, you can see a definite correlation between the service provider’s Net Promoter Score and the consumer perception of their customer service experience. AT&T has the most negative mentions of the top three service providers. Vivint has more negative comments than Xfinity but also more positive. Vivint is also the only provider with a net positive perception of the Quality of Customer Service, a surprising outcome to be sure.
Of course we have more data behind just this basic analysis. Quotes from consumers on specific issues, comments on the installation process and more, with data going back literally years to assess the impact of changes and new innovations being unleashed on the Smart Home market. You can get access to these tools yourself, using the Argus Analyzer. Learn more by clicking below.

Schlage Locks Up Smart Entry Market for Q1 2017
Smart Lock interest grew in 2017 as consumers holiday purchases turned into Saturday morning honey-dos. The big winners in Q1 were Schlage, August and Kwikset. The rest of the competitive landscape is littered with products that have been disappointing consumers persistently.
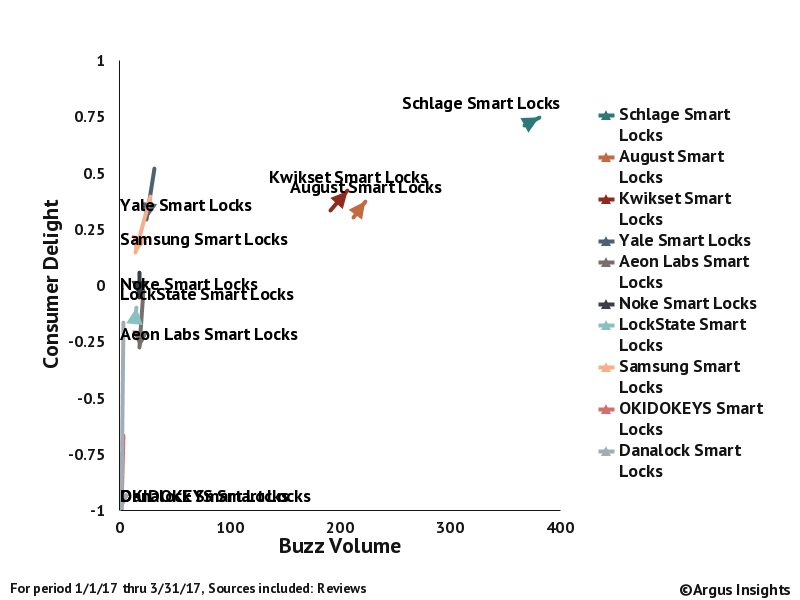
Schlage is leaps and bounds ahead of their competition, not only seeing increases in both buzz and perceived UX, but also almost double the demand of their closest competitor. Wow. What is Schlage doing to consistently beat out their traditional competition like Kwikset and Yale as well as the newcomers like August and Aeon Labs?
Well, it’s not their app. Schlage is lacking on the App side of the Smart Lock experience. August does a better job of delighting consumers with their app interface and their integration with Comcast Xfinity Home. Schlage and Kwikset, traditional hardware (yes, they actually cut and cast metal to make their products) companies have been lacking in their app ecosystem for Smart Lock customers.
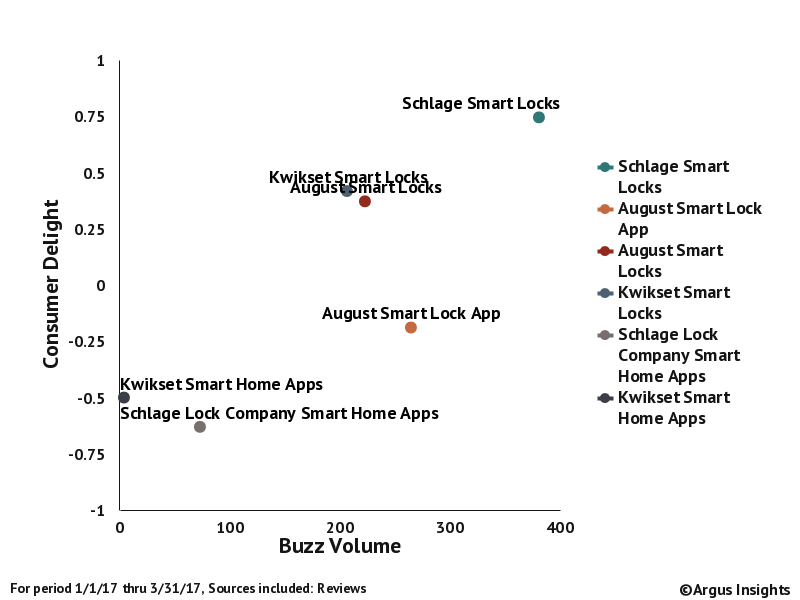
So why do consumers love Schlage locks but hate the apps? Why isn’t August dominating if their App is so much better? Turns out installation is important. When we dig into the details of how consumers talk about the installation experience a deeper story emerges…
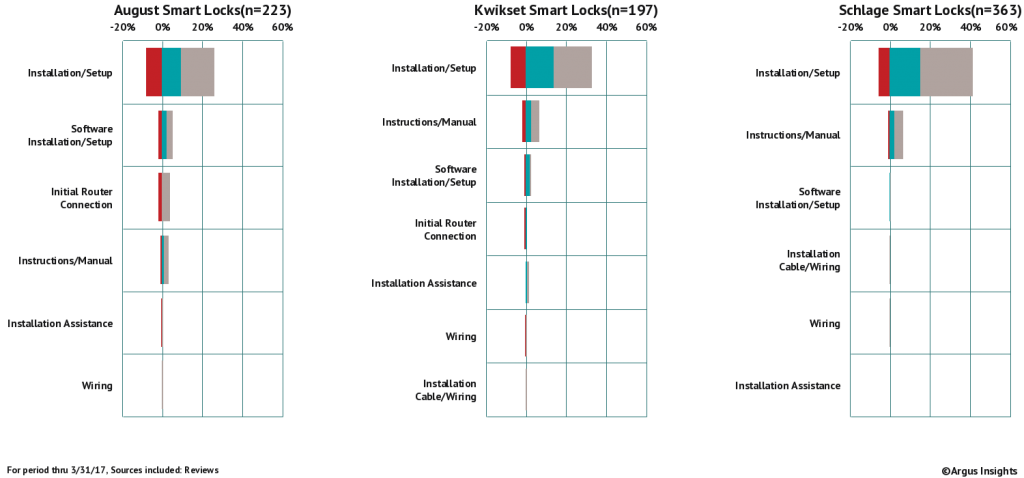
Schlage is just simply easier to install. Schlage customers are frustrated (the red bar) half as much as their competition. They are almost twice as delighted by the installation experience as August. Simplicity sells, period. When we look at both August and Kwikset, we see frustrations with the initial router connection, software/app issues as well as issues around wiring and help from the company itself with installation. That means that both August and Kwikset could gain on Schlage by just improving their out of the box experience. That’s it!
Want more? Want to dig deeper to understand who is using these locks? What to see how August is performing across their products? You can get access to these tools yourself, using the Argus Analyzer. Learn more by clicking below.

Seeing Is Believing: Q1 2017 Consumer Perceptions of Smart Home Cameras
With the close of the first quarter of 2017, we can start culling through all of the consumer reactions to Smart Home devices they have purchased in the last three months. One market segment that is always of interest is Security Cameras. The Nest Cam and Arlo are flagship products in this category that still contains a dizzying array of brands and packages, ranging from ten camera bundles sold at Costco to individual cameras flying off the shelves at Best Buy and Walmart. The question is, post purchase, which brands are delighting consumers by delivering on the promised experience?
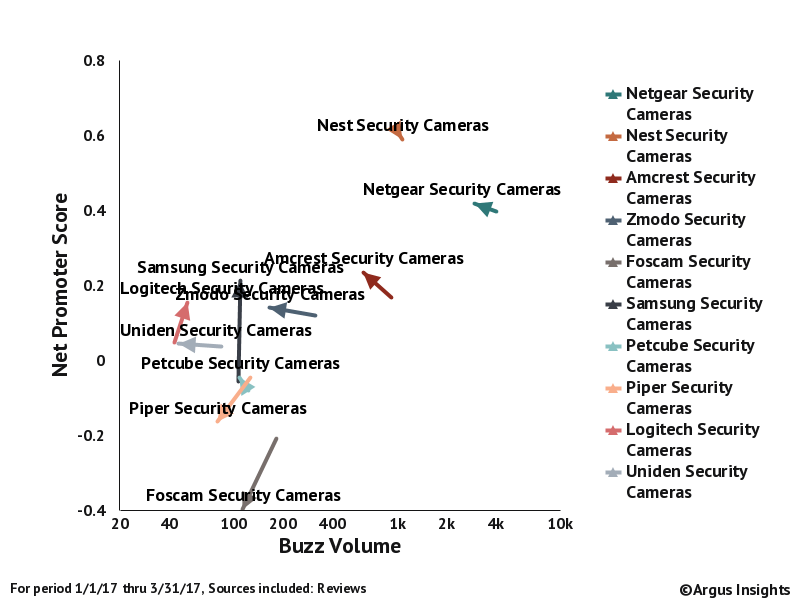
As you can see from the graph above, Nest and Netgear dominate the category. While we see demand for Nest Cam lower than the full portfolio of Netgear branded cameras, overall, Nest customers are happier with their user experience. You can see the cloud of other brands clustered in the area of lower demand and more frustrated users. Within this crowd, we see Logitech and Samsung making gains both in demand (Buzz is a proxy for demand) and Net Promoter Score. So what is the difference between Nest and Netgear for consumers? Some would argue that since Netgear makes most of the WiFi routers used to connect to these cameras, Netgear Cameras should be some of the easiest to set up, given that the initial connection to the WiFi router is a constant frustration for DIY consumers.
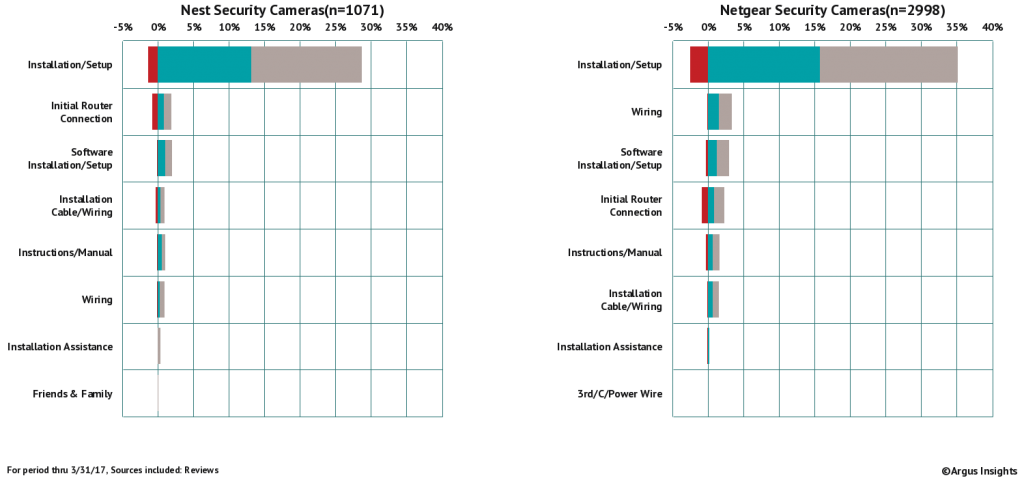
You can see from the Experience Funnels above (Red bars show what percentage of the reviews were negative, green indicates the percentage that were positive and grey is neutral) that Nest consumers mention the router set up more than software or any initial wiring. Overall the Nest Cam installation is a net positive experience. The same is true for Netgear. Since Netgear produces a range of cameras that compete both with the high end Nest Cam and lower end multi-camera bundles of Swann and others, you see Netgear consumers discussing Wiring and Software ahead of Initial Router Connection. While Netgear attracts more negative comments for their overall Installation experience, they receive a proportional increase in positive comments as well. In fact the Net Sentiment of Installation for Nest and Netgear is the same, about 13%, meaning that consumers for both brands found the overall experience of Installation to be positive, a key factor in driving Smart Home adoption.
Interestingly, Netgear’s prowess in WiFi did not translate into a significant differentiator for Smart Home Camera Installation compared to the other market leader, Nest. In a future post, we might dig deeper and do a direct comparison between Nest Cam and Netgear’s Arlo for a product level analysis.
If you can’t wait for the next post, check out our analytics platform, the Argus Analzyer, where you can dig deep into the bones of the user experience across the entire Smart Home market. You can also sign up for our free Smart Home market trend tracker, which includes basic access to the Analyzer and email updates whenever something causes the Smart Home market conversation in social media to jump.

What do consumers really ask Alexa and Google Home? Is it all Smart Home?
Whenever I speak about the transformative nature of voice interfaces for society’s favorite multi-user environment, the home, the question that comes up most of the time is how are consumers using products like Alexa or Google Home? Well, as it stands, we have that data… We’ve pulled the consumer reviews on both Amazon Echo and Google Home (the flagship products for both Amazon and Google) to see what usage scenarios consumers speak the most about. Different from survey analysis, where you present consumers a list of uses and they mark the ones they have every considered, analysis of the review comments pull out what is top of mind for consumers. When authoring reviews, consumers mention what is most important to them, not what is most important to the survey designer. This results in a prioritized list of what consumers consider to be most critical to their user experience. And guess what? It’s not Smart Home, per se.
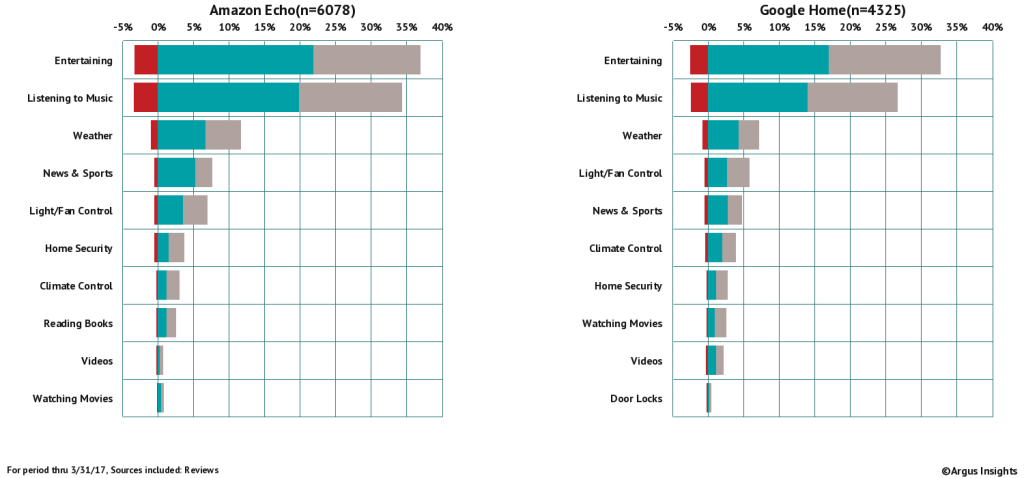
The chart above shows how often a use case is mentioned and the perception (negative, positive and neutral) of consumers discussing this use case. The X-Axis shows the percentage of all the reviews from 1 Nov 2016 to 31 Mar 2017 that mention a particular topic. You can see at the top of both products that Entertainment is mentioned by over 40% of all voice assistant users. After Listening to Music, the breadth of usage drops significantly with Weather in 3rd place for both. This is where the consumers diverge a bit. Alexa users mentioned catching up on News and Sports more than Google Home users. In fact, Google Home users prioritize Light/Fan Control (the first Smart Home use mentioned) above News and Sports. Light/Fan Control is actually the most mentioned Smart Home use for both ecosystems, a shift from the dominance of Thermostats/Climate control we saw in 2015. Google Home, with it’s Nest integration sees more use of Climate Control than Echo but both have Home Security above topics like controlling movie watching or Reading Books (Alexa allows you to listen to your Audible purchases through Echo and Dot, something about 3% of users are delighted by.
Great, but what does this mean for the theory that Voice Assistants are the killer gateway drug for Smart Home Adoption?
It helps but it is not yet the killer ‘app.’ When less than 10% even mention a Smart Home use for their voice assistant, we have a long way to go before there is a one to one relationship between Voice Assistant adoption and Smart Home bliss. It is important to note that these Voice Assistants are being used to curate audio environments first with lighting, climate and security falling below music, news and sports. Still, as consumers start to ask more of these assistants, it is logical to assume that any new Smart Home experience must tie into these ecosystems, within reason. You don’t want a would be thief yelling through your door, “Alexa, ask ADT to turn off the security system and unlock the doors.”
If you’d like to have more information like this at your fingertips, check out our Message Fit and Product Fit tools here. We’ve made our most basic Smart Home tools available for free so you can see what is driving the overall narrative and experience what life is like with a bit of Argus Insights sprinkled throughout your workflows.
In a future post, we’ll spend time looking at Siri and Apple Home’s position in this ecosystem as well as the recently announced Bixby from Samsung.
With that, “Alexa, Post Blog..”

