Some investor has had the audacity to file Class action lawsuit filed against Microsoft over Surface RT claims, saying that reports that the RT was selling well were patently false. Our demand analytics show that the Surface RT chugged along at the same rate as launch. If anything, recent discounts have raised demand for what might turn out to be an orphaned branch of the Windows family tree.
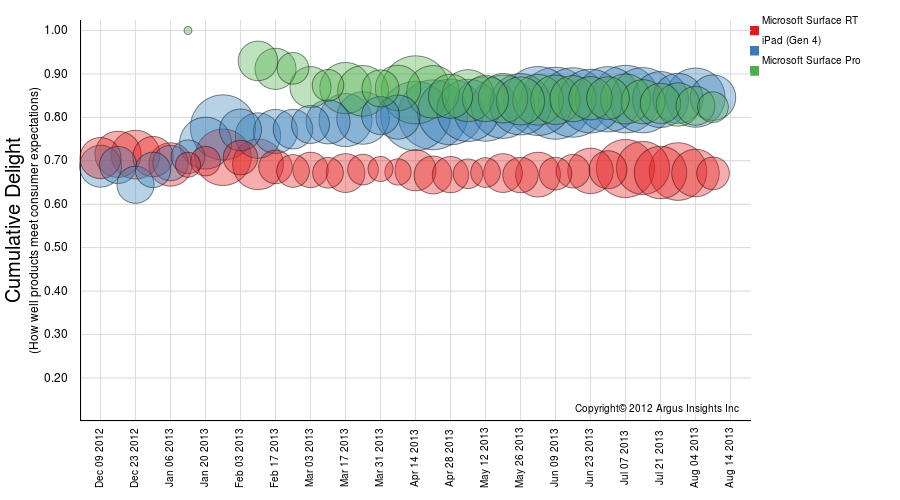
Surface RT did not have a drop in demand in July, supporting Microsoft’s claims that it was selling well.
What companies haven’t built a huge inventory expecting insane sales only to learn the hard way that markets take time to absorb new experiences. Even the vaulted iPhone only sold a few million during the first year. I am surprised the same investors are not suing Samsung for their gaff over the Galaxy S4 demand. To be fair, all of the RT tablets have seen anemic demand with only the Surface RT standing out at all. As you can tell from the graph above, consumers that bought the Surface RT held it in higher regard than the early iPad Gen 4 users. The Surface Pro only recently was eclipsed by the iPad Gen 4. While sales of the Surface RT did not match the hopes and dreams of Microsoft and the Windows faithful, it has successfully carved out a good niche in the tablet market and did not see a drop in demand in July as the case would have you believe. If Microsoft is guilty of anything, it is enthusiastic optimism.
Let us know if we can help you dig deeper as to what parts of the Surface RT experience delight and disappoint consumers.
The Guardian continues their recent line of hard hitting bits of investigative journalism on How low-paid workers at ‘click farms’ create appearance of online popularity. Imagine if you’re Coke and you’ve spent literally hundreds of millions of dollars to garner over 70 million facebook fans, only to find out not only is there little to no correlation to buzz and sales but that many of your fans are fake, figments grown at the many click farms cropping up to game page rank algorithms and the push by brands and the agencies that serve them to show performance gains.
Imagine if we could train chickens to click on Facebook like buttons…
We see the rotten fruits of click farms in the data we collect and the insights we cull for our clients every day. We continue to find new ways to distinguish real people from bots, sort the farms from real fans. Part of what we find is disturbing. Some brands are paying click farms to boost their results, justifying chat rooms filled with posers saying that if the party isn’t big enough real consumers won’t show up. Challenge is, real consumers are smarter than everyone realizes. They sniff out staged buzz bonanzas and shift their time, attention, and hard earned cash somewhere else. We see fake reviews voted down by consumers routinely in our analysis of consumer purchase behavior.
Many consumers click the like/fan button only for a quick hit, a free can of syrupy sweetness or mp3 download of the latest BeiberPerryLake song. This isn’t a relationship, its a drive buy. But for how brands measure their effectiveness in social today, it works. Likes go up, follower counts soar and the balance sheet doesn’t budge. Like spam, click farms only exist because it works, there’s a market for it, at times the very brands that loose the most from the actions of these farms, brand trust by consumers.
With the advancing tide of social engagement sweeping through Madison Avenue, Main Street and Wall Street, there is a rise of a particularly destructive disease, Brand Blindness. Brand Blindness occurs when brand blindly leverage these low cost, broad reach platforms to drive the wrong message to the wrong audience for the wrong offering. I recently received an email from Samsung offering an enticing dorm bundle for their back to school promotion. Given the ad, you would like I was a 19 year old college bound woman rather than an over forty male that hasn’t lived in a dorm for almost 20 years.
Samsung though to entice me to buy the dorm bundle even though it’s been almost twenty years since I lived in a dorm.
I’m sure you all have received posts like this and not just the endless spam for little blue pills, but ads from reputable Global 1000 companies that show how little they know of our habits, interest, or context. When our daughters will just born, I bought a box of Pampers baby diapers from Amazon.com. Price was good, usage at home was high, everyone wins, right? Except for the next six years I got ads from Amazon for diapers. Not bigger diapers, the same size diapers, for six years…
The brands are blind to context, blind to who we are and what it means to live our lives. Most companies have spent millions trying to create recommendation engines that tell what offer retailers should shove in our face next, predictive analytics to determine which path through the maze of offers and coupons is mostly likely to get us to buy, endless scenarios of A-B testing, all devoid of context. A-B testing does not help find C. Recommendation engines are based on what others bought not what consumers enjoy. And predictive analytics can only optimize the road most traveled.
This Brand Blindness hit AXE Body spray in a big way in early 2012. They had just launched their unisex scent (odor) Anarchy with a huge ad splash, interactive web comic on YouTube, and met with one of the worst launches that year. Argus Insights was doing a social campaign best practices project with Butler, Stern, Shine and Partners where AXE and Old Spice were one of the brand pairs we were studying. AXE stuck in our study of over 10 brand pairs in that it had the highest percentage of negative mentions, including twitter memes like “Dear Axe Body Spray, Please put a suggested serving size on your bottle. Sincerely, Choking Girls Everywhere.”
Hmmm, this is supposed to make women feel engaged with the AXE Anarchy Brand?
AXE launched the Anarchy the way they had launched all of their other products, videos of attractive women losing it over hopeful young men just after drenching themselves in product. Now, they were launching a product targeted at the 50% of the population missing from their sales but using an approach and brand story proven to annoy the target. Blind as a bat with it’s ears plugged…
Brand Blindness is effecting us all. We’re working on a cure at Argus Insights so that branding/product disasters like this do not continue to bleed resources from companies or drive increased distance between brands and their consumers. Help is on the way.
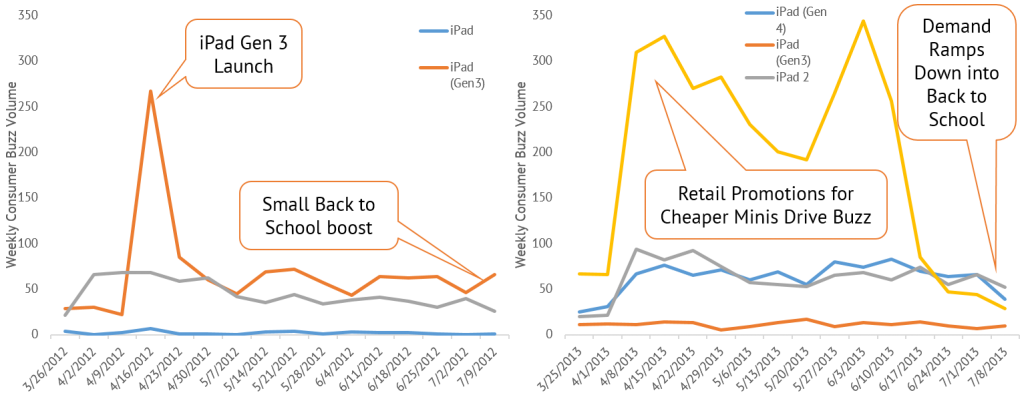
Strategy Analytics recently released findings that Android sales have been much higher than iPad sales. We’ve seen the iPad stumbling since the launch of the Gen 4 iPad and the iPad mini in the fall. The closing experience gap between Android and iOS tablets has led to eroding demand and aggressive price cutting by US retailers Walmart and Best Buy for new iPads to drive up sales. The only ace Apple may have up their sleeve for Q3 2013 is the rush by parents to equip students with tablets. Apple’s bet on retaking the education market by partnering with textbook publishers could pay out this fall as an increasing number of institutions require iPads for classroom use.
Comparing Back to School iPad demand for 2012 and 2013 shows demand sliding for 2013.
Issue is that we are seeing sliding demand as we head into Back To School season. After a spring of iPad mini promotions we are seeing saturation effects across all the iPads with the exception of older iPad 2 models still being snapped up. The impact on mini demand by a small price drop shows a saturation of iPad with newer experiences not requiring the same upgrade path that the iPhone has over the years. We think Strategy Analytics is on the right path with Q3 being another week iPad quarter. If we see things change, we will let you know!
Our last post looked at the two populations of Walking Dead and Vampire Diaries watchers as separate populations. The next challenge was to uniformly compare two audience groups and their social media activity on Twitter. Argus obtained buzz data for The Vampire Diaries and The Walking Dead by seeking Tweets with the words ‘vampire diaries’ or ‘walking dead’ in their body. Hence, there is a sample bias and it explains why Argus had more data for The Vampire Diaries than for The Walking Dead; while Tweets with the word ‘vampire’ were evaluated, Tweets with the word ‘zombie’ were not. Due to this disparity, it was necessary for Argus to equally compare the two groups to accurately assess buzz and viewership. The statistical tool used to enable this comparison was computing the Z-score for the two populations.
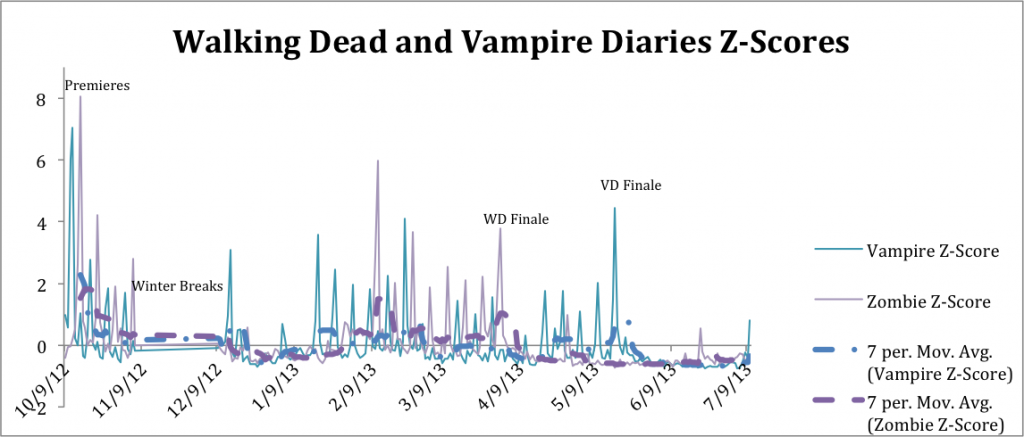
Z-scores were essential to analyzing the social dynamics of these populations. Shifts in data, due to premieres and finales, in both shows were now compared on a uniform platform without the sample bias distorting outcomes. By disregarding the sample bias, Z-scores allowed Argus to compare analysis, unlike before. A standard score, or a Z-score, specifies how many standard deviations data or an observation are below or above the mean. A positive Z-score denotes a value above the mean while a negative Z-score indicates a value below the mean. This dimension-less measurement allowed Argus to further compare episodes of The Walking Dead and The Vampire Diaries based on social media buzz. After calculating the mean and standard deviation of buzz for both series, every episode was assigned a Z-score ranging from -1 to upwards of 8, meaning the buzz for that day was, at its peak, 8 times the standard deviation above the average. This allowed Argus insights to compare the relative viewership based on the disparate samples in a meaningful way. Figure 1 is a graphical representation of the scores.
Figure 1. Daily z-scores ranged from -1 to 8, with season premieres producing the highest scores. Z-scores quickly declined during the winter break and weeks after each season finale, when new episodes were not airing.
Season premieres saw the highest Z-score of any episodes. The Vampire Diaries premiere had a Z-score of 7.03 while The Walking Dead premiere had a score of 8.05, meaning that the Walking Dead premiere was more popular than the Vampire Diaries broadcasting. The mid-season and finale broadcastings also attracted higher levels of viewers given the particular theatrics associated with the episode. Interestingly enough, The Vampire Diaries finale was more popular than The Walking Dead finale, a curious fact given that Walking Dead was more popular per broadcasting for all episodes. Once the finale aired there was less viewer buzz due to the lack of new, weekly content. However, Walking Dead buzz decreased as a slower rate after its finale than Vampire Diaries, which decreased at a significantly higher rate. This could be attributed to various things, for example the level of engagement with post-season content that either series offered viewers once the season had concluded. Nevertheless, whether or not grand finales drive future levels of viewership will be of interest in the coming seasons to Argus.
Based on the research of Lindsay Nichols and Griselda Arzate